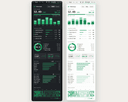
Tokenscope is a free, open-source menu-bar dashboard that reads Claude Code’s local JSONL logs to display daily, weekly, and monthly token usage and cost by model, plus MCP and Skill call counts — all without sending data over the network.
What is Tokenscope?
Tokenscope is a read-only macOS and Windows app that scans ~/.claude/projects/**/*.jsonl for every assistant message, its token usage, model, and tool calls. It deduplicates streaming retries by message.id, merges multi-line messages, and prices each request against rates from models.dev (primary), LiteLLM (fallback), or a built-in offline snapshot. The app renders a dashboard showing cost by model, request counts, a token usage heatmap (12‑month view), and MCP/Skill call breakdowns — with auto-refresh every 30 seconds. It is built by HduSy and available on GitHub under an MIT license.
Key Features
- Read-only local analysis — Scans Claude Code’s JSONL logs from disk; no uploads, no API keys, no telemetry. No data ever leaves your machine.
- Deduplication — Collapses streaming retries by
message.id and merges multi-line messages so each turn is counted exactly once.
- Pricing with offline fallback — Matches models on models.dev first, then LiteLLM, then a built-in snapshot. Rates are cached for 24 hours and work offline.
- Menu-bar dashboard — Shows today’s token cost at a glance; click opens a full dashboard with bar charts, donut charts, and a GitHub-style heatmap of daily token volume over the last 12 months.
- Cache visualization — Displays cache hit rates (e.g. “-463929% cached”) and costs for cache write vs. read tokens, highlighting how prompt caching affects total spend.
- Tool usage breakdowns — Lists MCP server calls (with names like
github, playwright) and Skill calls (e.g. find-skills, skill-creator), filtering out Anthropic’s bundled tools.
- Screenshot sharing — One-click export of the dashboard to share usage “report cards” on social media.
- Auto-refresh — Background process watches file
mtime changes; panel refreshes every 30 seconds with zero idle CPU impact (~40MB memory).
Who is it for?
- Claude Code power users who want to see daily/weekly/monthly token spend per model and compare costs across Opus, Sonnet, GPT‑5, Gemini, etc.
- Developers managing AI budgets — track whether their usage fits within subscription tiers (e.g. Zhipu Lite’s 5‑hour plan) and spot which models burn the most tokens.
- Team leads or freelancers who need to justify tooling costs and identify actual MCP and Skill usage to cut unused services.
- Open-source enthusiasts who prefer a local, privacy‑first alternative to cloud dashboards.
What can you do with Tokenscope?
- Compare model costs: View a breakdown like “Opus 4.1: $19.10, Sonnet 4.5: $18.40, GPT‑5: $6.20” for the current period and see which models are most expensive relative to token volume.
- Identify tool usage patterns: See that you made 10 MCP calls across 5 servers (e.g. github 3, playwright 2) and 12 Skill calls across 5 skills — and filter out bundled tools to focus on what you installed.
- Understand cache efficiency: Observe that 2.4M cache‑read tokens cost only $0.72 while 0.32M output tokens cost $4.80, helping you optimize long‑running sessions.
- Track long‑term trends: Use the 12‑month heatmap (Dec–Jun example) to spot usage spikes and weekly/monthly breakdowns that reveal personal AI‑usage habits.